 FIELD
FIELD How to read a geologic map
A geologic map is an X-ray of the ground — a sheet of colours and symbols that tells you which rocks lie beneath your boots and how they are arranged. Learn to read one and you can predict what you will find before you ever swing a hammer.
A geologic map shows the distribution, age and structure of the rock units at or just beneath the Earth’s surface. Where an ordinary road map records towns and highways, a geologic map records rock — each colour marking a distinct unit, each line a boundary between them, each little symbol a clue to how the layers are tilted or broken. For a rockhound it is the single most useful document you can carry, because it turns a blank landscape into a set of testable predictions: this ridge is Cambrian limestone, that valley is granite, this contact is where the two meet. Reading one draws on the same habit of mind as any field test — matching what the map claims against what the outcrop actually shows — and it pairs naturally with knowing your igneous, sedimentary and metamorphic rock types. This guide explains the colours, the symbols, the lines and the cross-section, and shows how to put a geologic map to work in the field.
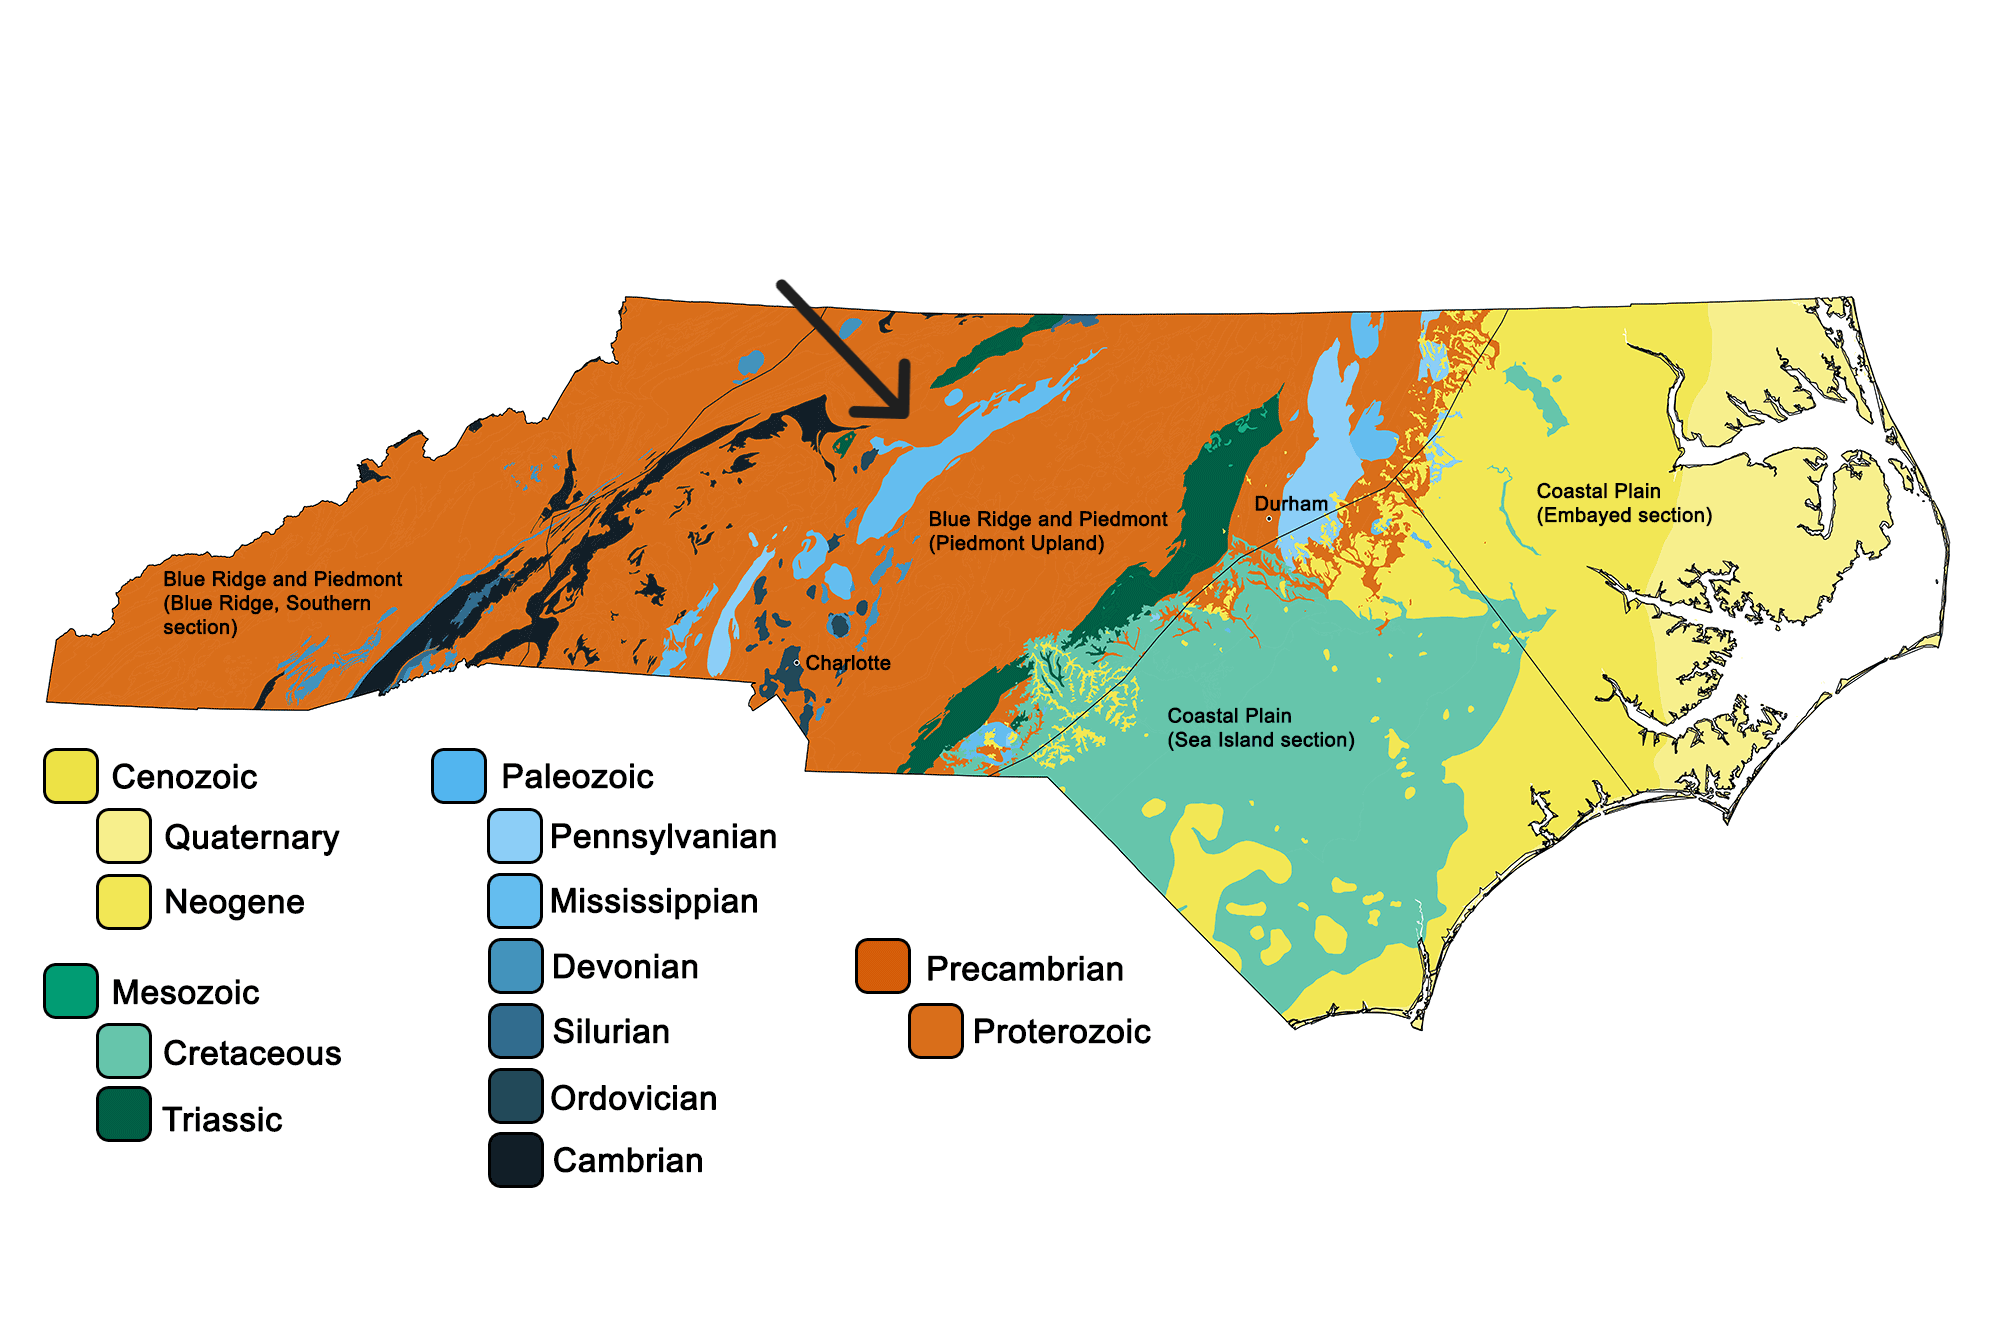
What a geologic map shows
A geologic map is drawn on top of a base map — usually a topographic sheet with contour lines and place names — and over that base it paints the bedrock. Every area of a single colour is a map unit, a body of rock of a particular type and age that a geologist has walked out and traced across the ground. The map shows where each unit reaches the surface (its outcrop), how the units border one another, and how faults and folds have shifted them. Crucially, it shows the bedrock as it would look with the soil and vegetation stripped away, so a single green patch on the map may in reality be a grassy hillside with only a few rocky exposures. Learning to picture the solid rock beneath the cover is the heart of map reading, and it is exactly the skill that lets you predict where geodes or agate-bearing beds will crop out.
The key: colours, symbols and the explanation
Every geologic map comes with an explanation, or legend, and you cannot read the map without it. Each map unit is given a colour and a short letter symbol: an uppercase letter for the geologic period — Q for Quaternary, K for Cretaceous, J for Jurassic, C for Cambrian — followed by lowercase letters naming the formation, so Kss might read « Cretaceous sandstone ». There is a loose international convention to the colours, with yellows and pale tones for young sediments and richer colours for older rocks, but the legend is always the final word. The units in the explanation are listed in age order, youngest at the top and oldest at the bottom, and each carries a brief description of the rock. Read the explanation first, top to bottom, and the map stops being a jumble of colours and becomes a stack of named, dated rock bodies.
On the map itself
- Coloured areas — individual rock units
- Solid lines — contacts between units
- Heavy lines — faults
- Strike-and-dip symbols — tilt of the beds
- A line of section (A–A′) — the cross-section route
In the explanation
- A colour box and letter symbol per unit
- Units listed youngest to oldest
- A short rock description for each
- Symbols for faults, folds and dip
- Map scale and contour interval
Contacts, faults and folds: the lines on the map
The lines between colours carry as much information as the colours themselves. A plain solid line is a contact, the boundary where one rock unit meets another; a dashed line means the contact is approximate or concealed. A heavier line, often with small tick marks or arrows, is a fault — a fracture along which rocks have moved — and the ticks show which side dropped or which way it slid. Folds appear as lines too: an anticline (an upfold) is marked by an arrowed axis with the arrows pointing outward, a syncline (a downfold) by arrows pointing inward, and reading them tells you the rocks were squeezed and bent. Where a fold has been eroded flat you see its structure as a pattern of stripes on the map: matching bands of colour running parallel and repeating on either side of an axis are the surest sign that layered rocks have been folded, a three-dimensional shape flattened onto the page.
Strike, dip and the third dimension
A geologic map is flat, but the rocks are not, and a small strike-and-dip symbol is how the map records their tilt. The long line of the symbol is the strike — the compass direction of a horizontal line along the tilted bed — and the short tick at right angles points down the dip, the direction the bed slopes, with a number giving the dip angle in degrees. A tiny cross with no tick means the beds are horizontal; a symbol with a 90 means they stand vertical. Together these ticks let you reconstruct the layers underground, which is what the cross-section printed along the bottom of most maps does for you: it is a slice through the Earth along a marked line (labelled A–A′), showing the units diving, folding and faulting below the surface. Reading the map and its cross-section together turns a two-dimensional sheet into a genuine picture of the rock in three dimensions — the difference between knowing a rock is present and knowing how deep it goes.
Using a geologic map in the field
For rockhounding, a geologic map is a treasure chart once you know how to read it. Start by identifying the unit you want: if you are after agate you might look for volcanic units, for fossils a marine sedimentary formation, for petrified wood a river or lake deposit. Find that unit’s colour in the explanation, then trace its outcrop across the map and note where it is likely to be exposed — along stream banks, road cuts, ridgelines and steep slopes where soil is thin. Pay special attention to contacts, because the boundary between two units is often where interesting mineralisation occurs, and to faults, which can bring mineral-rich fluids up from depth. Match the map to the ground as you walk: check that the rock you find agrees with the unit the map predicts, and if it does not, trust the outcrop and re-read the map. Always confirm you are on land where collecting is permitted before you dig, and pair the map with a good sense of your rocks and minerals so you recognise the prize when it appears.
Cautions and common mistakes
The first mistake is to forget that a geologic map shows bedrock, not the surface. Under fields, forests and towns the rock is hidden by soil and there may be no exposure at all, so a colour on the map is a prediction of what lies beneath, not a promise of a rock you can pick up. Second, do not ignore the scale: a state map at 1:500,000 lumps many formations together, while a detailed quadrangle at 1:24,000 shows them separately, and expecting a small-scale map to guide you to a single outcrop leads to frustration. Third, do not confuse a geologic map with a plain topographic one — the contour lines beneath the colours show elevation, the colours show rock, and the two answer different questions. Fourth, resist reading the colours without the explanation, because colour conventions vary from map to map and only the legend is authoritative. Finally, remember that maps are interpretations made at a moment in time; where the map and a fresh outcrop disagree, the rock in front of you wins, and a good field geologist treats the map as one strong line of evidence among several, exactly as they would any single field test.
Frequently asked questions
What is a geologic map?
A geologic map shows the type, age and structure of the rock units at or just beneath the Earth’s surface. It is drawn on a topographic base and uses colours for rock units, lines for the boundaries and faults between them, and small symbols for the tilt of the beds.
What do the colours on a geologic map mean?
Each colour marks a distinct rock unit of a particular type and age. There is a loose convention — pale yellows for young sediments, stronger colours for older rocks — but the map’s explanation, or legend, is always the final word, giving each colour a letter symbol and a rock description.
What do strike and dip symbols mean?
A strike-and-dip symbol records how a rock layer is tilted. The long line is the strike, the compass direction of a horizontal line on the bed; the short tick points down the dip, the direction the bed slopes; and a number gives the dip angle. A small cross means the beds are horizontal.
What is the difference between a geologic map and a topographic map?
A topographic map shows the shape of the land with contour lines of elevation. A geologic map adds the bedrock, painting rock units in colour over a topographic base. The topography tells you the terrain; the geology tells you the rock beneath it. Most geologic maps combine both.
How do you read a geologic cross-section?
A cross-section is a slice through the Earth along a line marked on the map, usually labelled A–A′. It shows the rock units continuing below the surface, folding and faulting with depth. Read it alongside the map, using the strike-and-dip symbols, to picture the rocks in three dimensions.
How can a geologic map help with rockhounding?
Find the rock unit likely to hold what you want — volcanics for agate, marine beds for fossils — then trace its outcrop and look where exposure is good, such as road cuts and stream banks. Contacts and faults are especially promising. Always check that collecting is permitted first.
Want specimens to match what your map predicts?
Sponsored — partner shop · Minerals Kingdom
A geologic map is most powerful once you can read the rock it points to — brush up on your igneous, sedimentary and metamorphic rocks, the difference between a rock and a mineral, and how to tell a fossil from a rock. New to the hobby? Start with how to start rockhounding, then let the map choose your next spot.
Written by The Field & Stone Editors · Published by KEVALEX Group.